How-to: Generating graphical reports for capacity overview
Introduction
This report provides an insight to the remaining capacity for a certain period. It is a graphical depiction of the capacity overview report. For more information, see How-to: Generating reports for capacity overview.
Requirements and prerequisites
To be able to generate reports, users must ensure the following:
How do I generate graphical reports for capacity overview?
- On the Reporting services integration: Management page, select the relevant report. For more information, see Configuring a report parameter – Reporting services integration.
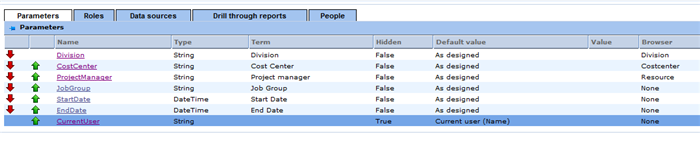
- Select the Parameters tab to configure the respective parameters, as displayed in the following:
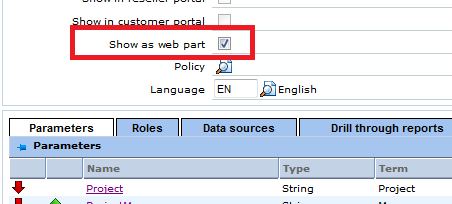
- To add or view the report on a project card as web part, select the Show as web part check box, as displayed in the following:
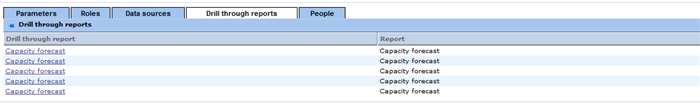
- Click the Drill through reports tab and define the settings, as displayed in the following:
- Click Save to save the defined parameters and click View to see the report. The following is an example of the report:
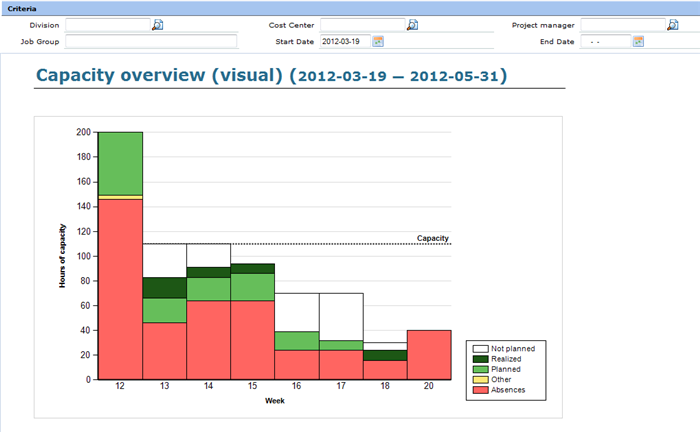
- To see a more detailed report, click the bars in the bar chart. For more information, see How-to: Generating reports for capacity overview.
Related documents
| Main Category: |
Support Product Know How |
Document Type: |
Online help main |
| Category: |
On-line help files |
Security level: |
All - 0 |
| Sub category: |
Details |
Document ID: |
23.443.567 |
| Assortment: |
Exact Synergy Enterprise
|
Date: |
03-05-2012 |
| Release: |
249 |
Attachment: |
|
| Disclaimer |